
Network Block I - Domains
Introduction
Well, as I mentioned in the previous post, I was going to split presenting my HomeLab into different posts to avoid making it too long. This is the second publication of all those to come. I could have grouped the entire network block together, but this part contains a lot of details and would have been too long.
This is the network block referring to all the Internet parts that I do not manage directly.
If this is your first time reading this blog, I invite you to check out the other entries here:
- Introduction to my HomeLab - Startup and First Steps
- Network Block I - Domains
- Network Block II - Services
- Management Block I - Administration
- Management Block II - Monitoring
- Services Block
- Tweaks, Backups, and Extras
Below, I show you the logical network diagram representing only the parts I will cover in this block:
(nginx proxy manager)
npm.jrodriiguezg.lan"]:::proxyNode end %% Raspberry Pi 4 Subgraph subgraph RPi4 ["Raspberry Pi 4"] subgraph LAN_RPi ["Local Network LAN"] phns1["phns1.jrodriiguezg.lan
(PiHole + Unbound / DNS 1)"]:::rpiNode wireguard["Tailscale / Wireguard
(deprecated)
wireguard.jrodriiguezg.lan"]:::vpnNode end end %% HP Elitedesk Subgraph subgraph HP ["HP Elitedesk"] subgraph LAN_HP ["Local Network LAN"] phns2["phns2.jrodriiguezg.lan
(DNS 2)"]:::eliteNode end end %% Flows and Connections tunnel --> npm npm -.-> phns1 npm -.-> phns2 npm -.-> wireguard %% Subgraph styles (Transparent Background) style WAN fill:none,stroke:#27272a,stroke-width:1px,color:#a1a1aa; style Proxy fill:none,stroke:#27272a,stroke-width:1px,color:#a1a1aa; style RPi4 fill:none,stroke:#f43f5e,stroke-width:1px,color:#fda4af; style HP fill:none,stroke:#3b82f6,stroke-width:1px,color:#93c5fd; style LAN_RPi fill:none,stroke:#2d2d30,stroke-width:1px; style LAN_HP fill:none,stroke:#2d2d30,stroke-width:1px;
A Little Theory
Before starting to talk about the network block and, specifically, about this first part (domains), I will comment on some theory in case the person reading this is not familiar with the terms I use. First of all:
What is a domain?
It is a unique and exclusive address that identifies a website on Internet, allowing a user to find it easily. It is the digital name or mailing address that avoids having to remember numerical IP addresses. An example of this is this very domain: docs.jrodriiguezg.link.
Now the next one,
DNS?
The DNS (Domain Name System) is like the phone book of the Internet. Its sole purpose is to map a domain to the IP address where it is located. Thus, when someone types a domain in the browser, this system automatically redirects them to the hosting server.
Now that we know what a domain and DNS are, let’s look at the provider I chose: Cloudflare.
And why Cloudflare? After looking at several options (Ionos, Hostinger, etc.), Cloudflare was the one that offered the most for the lowest price. The base plan has many interesting features, is fast and secure, and the analytics panel is wonderful.
Now I will explain the domains I have: I have two public ones and one private one, which then branch into subdomains.
The Domains
At an internal level, I have a domain ending in .lan, which resolves to 12 subdomains for each service deployed, which we can see in the following diagram:
(Nginx Proxy Manager)"]:::proxyNode CatProxy --> npm %% Subdomains on Raspberry Pi 4 hmr["hmr.jrodriiguezg.lan
(Homarr)"]:::rpiNode phns1["phns1.jrodriiguezg.lan
(DNS 1 / PiHole)"]:::rpiNode uptime["uptime-kuma.jrodriiguezg.lan
(Uptime Kuma)"]:::rpiNode gitea["gitea.jrodriiguezg.lan
(Gitea Server)"]:::rpiNode wg["wireguard.jrodriiguezg.lan
(VPN)"]:::rpiNode portainer1["portainer.jrodriiguezg.lan
(Portainer)"]:::rpiNode CatRPi4 --> hmr CatRPi4 --> phns1 CatRPi4 --> uptime CatRPi4 --> gitea CatRPi4 --> wg CatRPi4 --> portainer1 %% Subdomains on HP Elitedesk jelly["jellyfin.jrodriiguezg.lan
(Jellyfin Media)"]:::eliteNode navi["navidrome.jrodriiguezg.lan
(Navidrome)"]:::eliteNode qbtt["qbtt.jrodriiguezg.lan
(qBittorrent)"]:::eliteNode phns2["phns2.jrodriiguezg.lan
(DNS 2)"]:::eliteNode zabbix["zabbix.jrodriiguezg.lan
(Zabbix)"]:::eliteNode CatHP --> jelly CatHP --> navi CatHP --> qbtt CatHP --> phns2 CatHP --> zabbix %% Subgraph styles (Transparent Background) style Root font-size:16px; style CatProxy fill:none,stroke:#27272a,stroke-width:1px; style CatRPi4 fill:none,stroke:#f43f5e,stroke-width:1px; style CatHP fill:none,stroke:#3b82f6,stroke-width:1px;
These are not accessible from the Internet
At an external level, that is, facing the public, I have two domains, both purchased from Cloudflare. These are jrodriiguezg.link and lemoe.link, which host several subdomains as shown below:
As I think you have realized because I mentioned it, I use Cloudflare for the management of the parts exposed to the Internet, as well as the domains. Because of this, and so that you can see a bit of the Cloudflare dashboard (dash.cloudflare.com), I am going to show some of the most important configurations and highlighted sections of the console.
A Tour of the Dash
As I mentioned half a paragraph ago, I’m now going to show the Cloudflare dashboard, some of the configurations I have applied (just some, it has a thousand things!), as well as interesting parts.
Basic Configurations and Interesting Sections
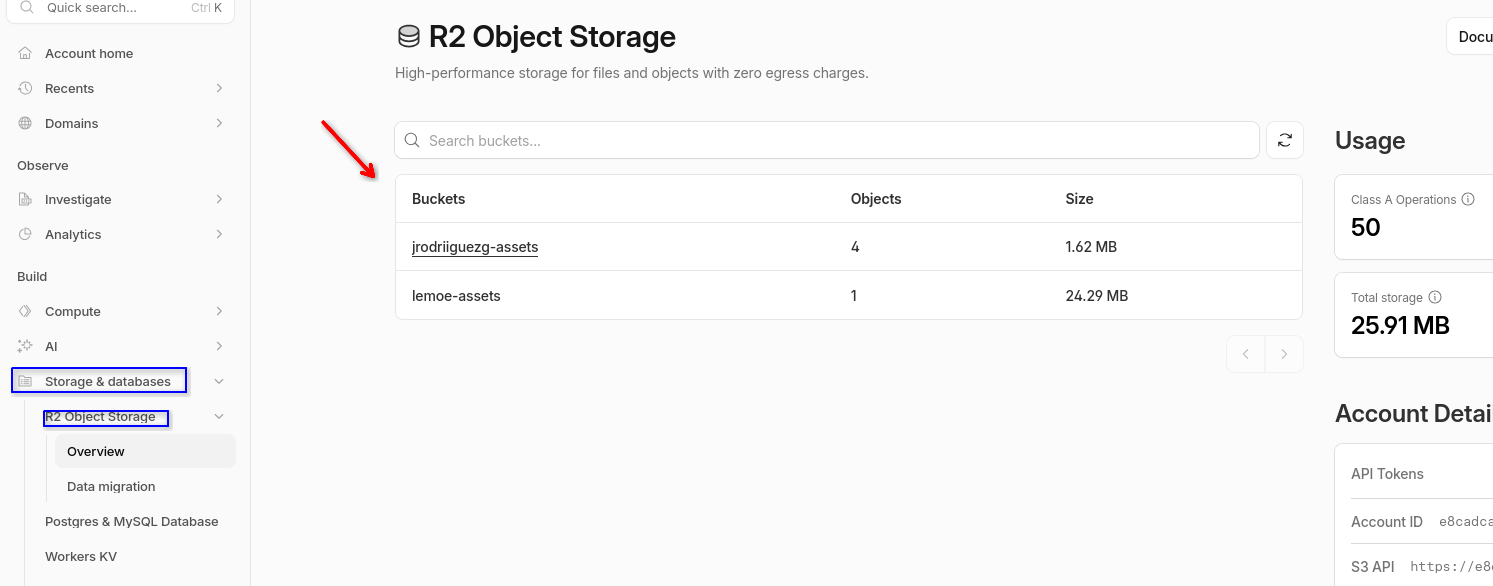
The first thing I’m going to highlight are the buckets, which are storage instances that Cloudflare provides for free (up to 10 GB free). The images you see here are stored there.
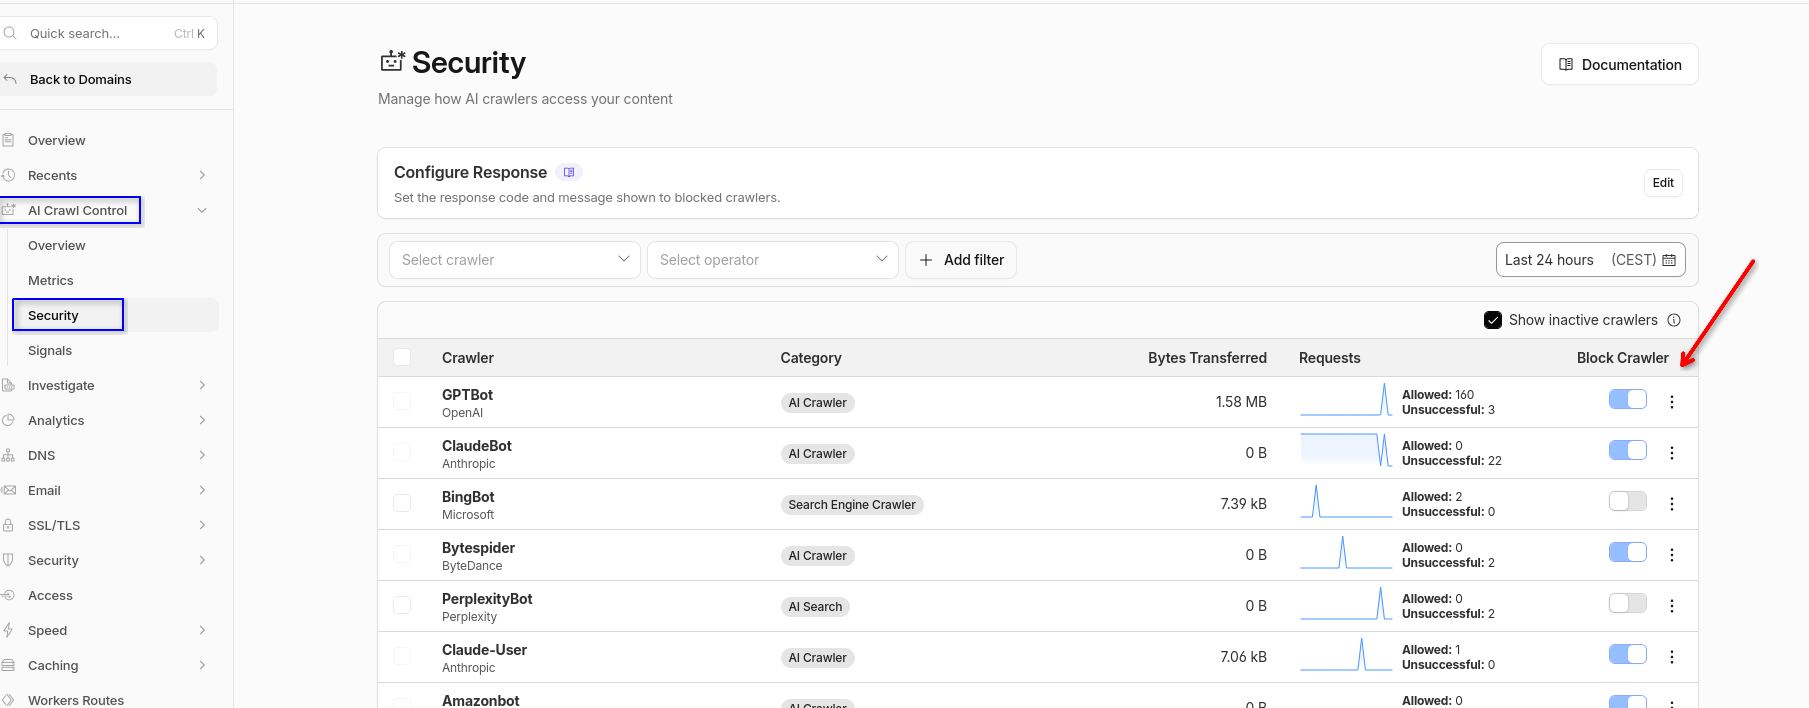
Another interesting thing is the ability to block certain crawlers. These are the bots used by AI services and some search engines to scan web pages and analyze their content; I have them blocked (only some).
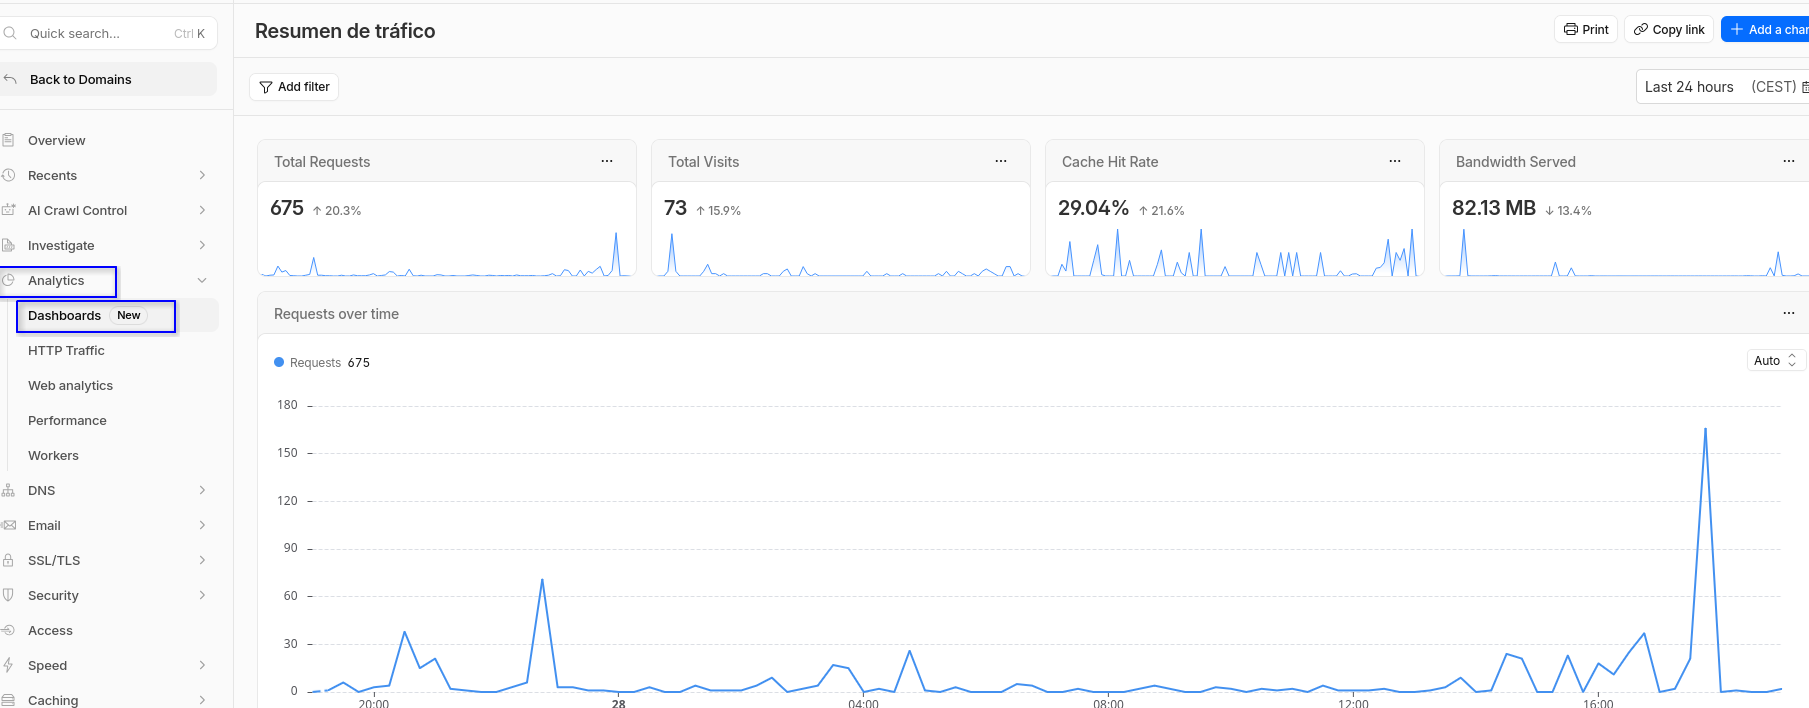
The next one is the most basic screen, the web traffic dashboard, which shows real-time traffic of the domain or both (depending on the configuration).
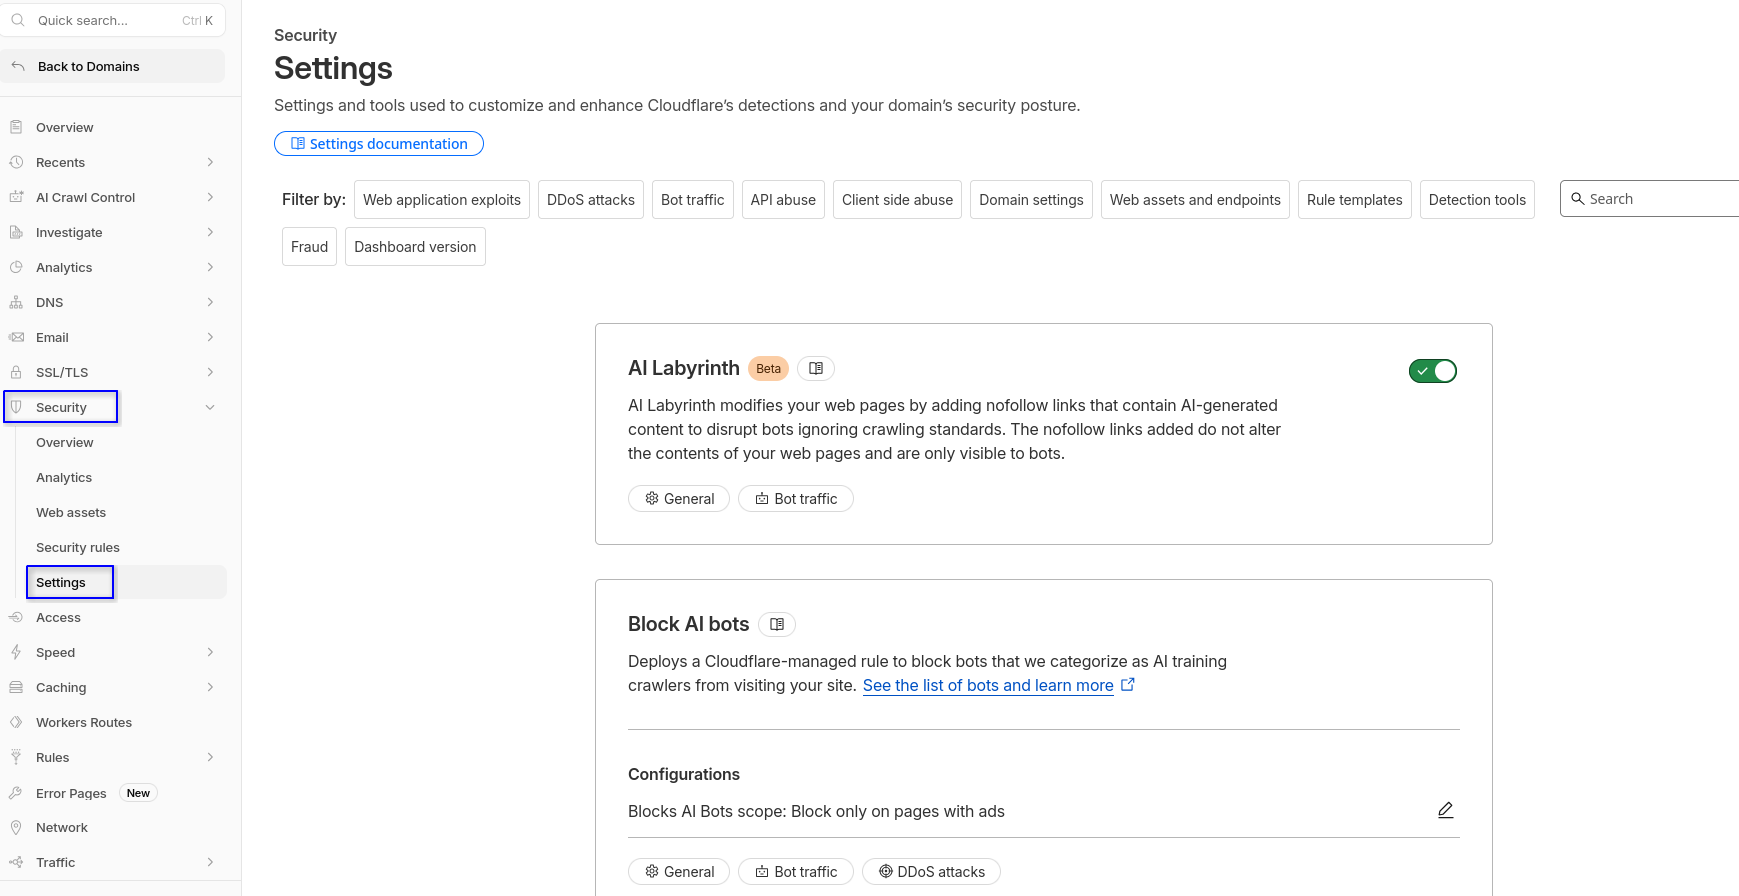
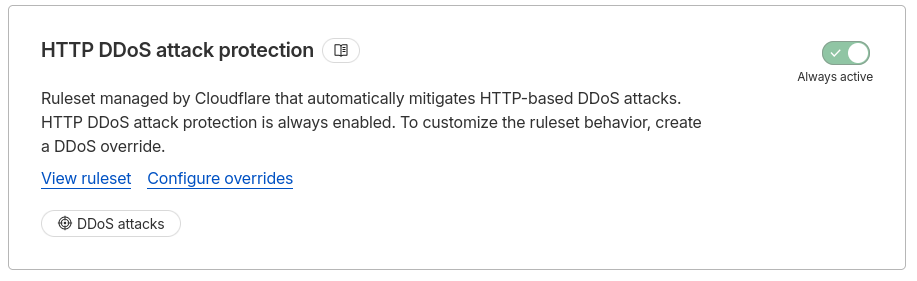
From the security settings, you can block certain things or activate security measures. Some of these include the AI crawler shield or blocking DDoS attacks.
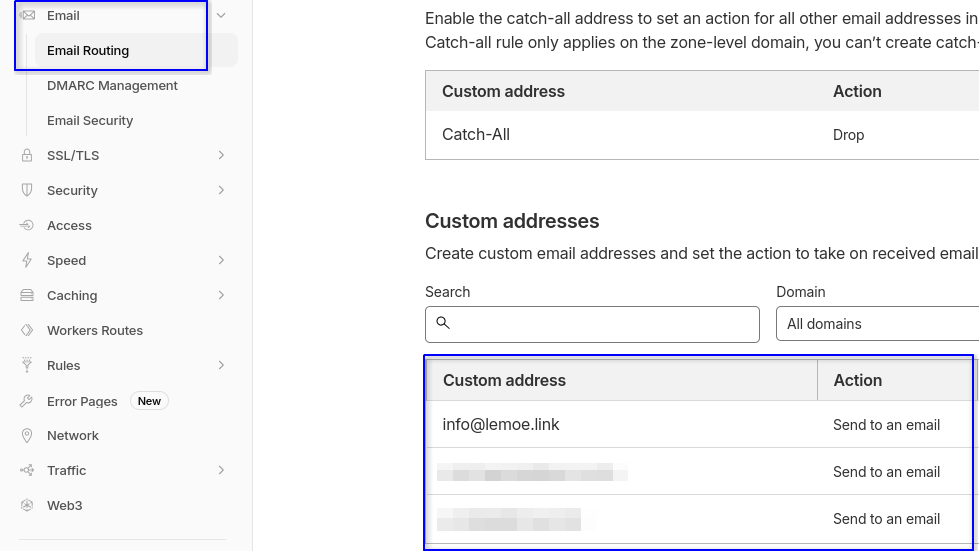
Cloudflare does not offer email inboxes (at least I haven’t found them); what it does offer is email routing using the domain.
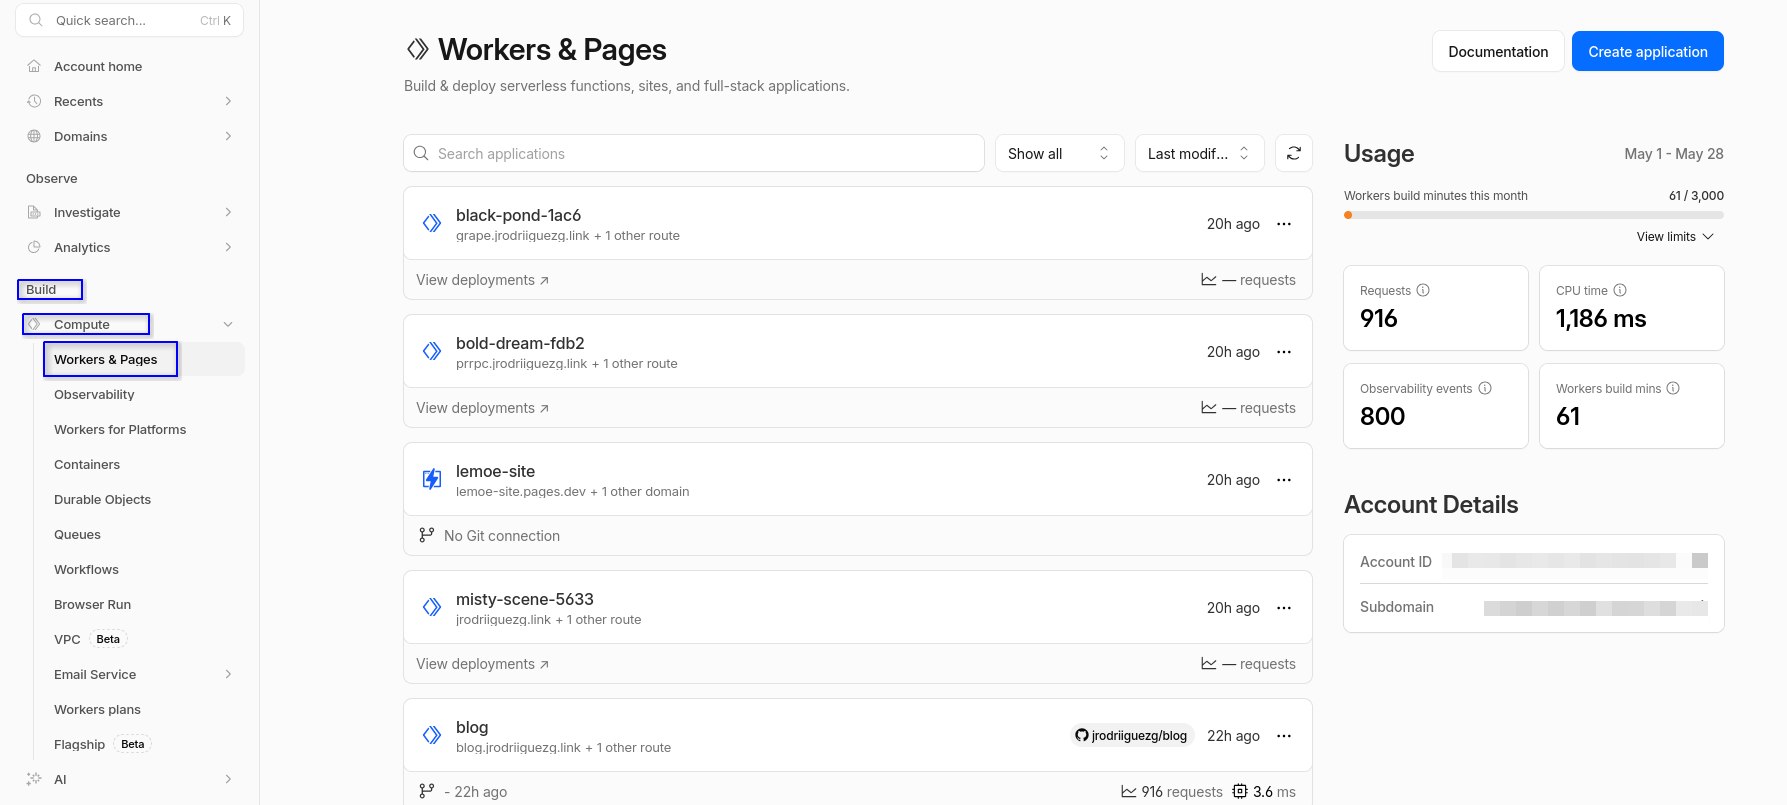
And, finally, the workers and pages. This is storage for static websites; here, for example, this very blog is hosted.
The tour was short because looking at all the options in the dash would make this post very long. If you are looking for a domain, I encourage you to use Cloudflare as it works very well.
I haven’t mentioned this, but there are two domains at the external level that serve content from my local infrastructure, using an official Cloudflare service called cloudflared, which we will look at now.
Connection with the Local Infrastructure
As mentioned before, I have two domains that are served from the local infrastructure (I’m not going to say which ones, but they are there). To serve these domains, I used a Cloudflare service called cloudflared that creates a tunnel between my infrastructure and Cloudflare’s.
The part of the dashboard where we find this is called Cloudflare Zero Trust or Cloudflare One.
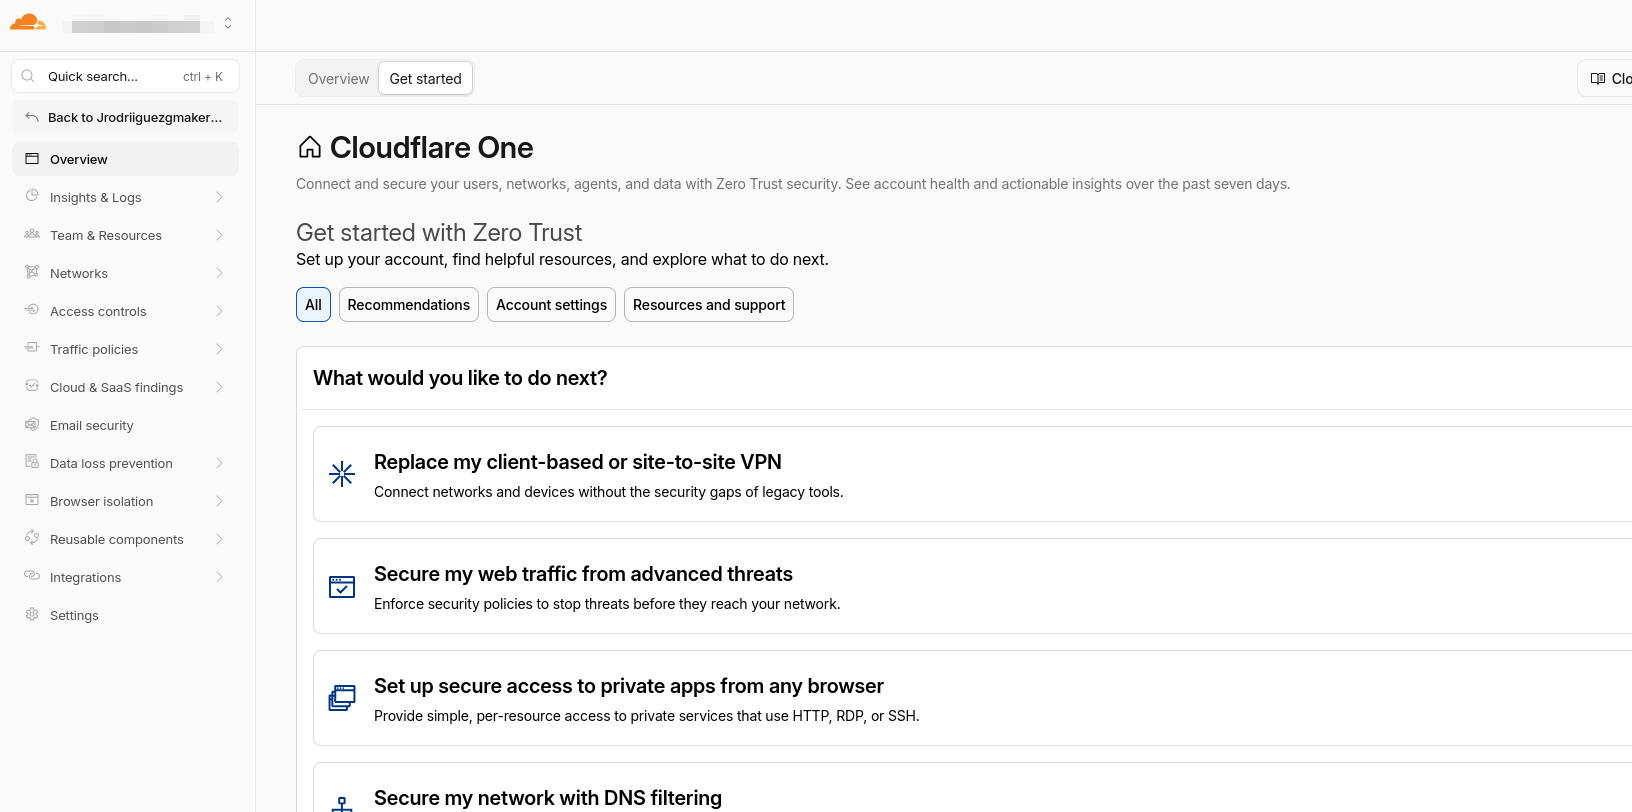
In this case, we go to the connectors where we have the created connector; from here, the domains we want to expose are managed.
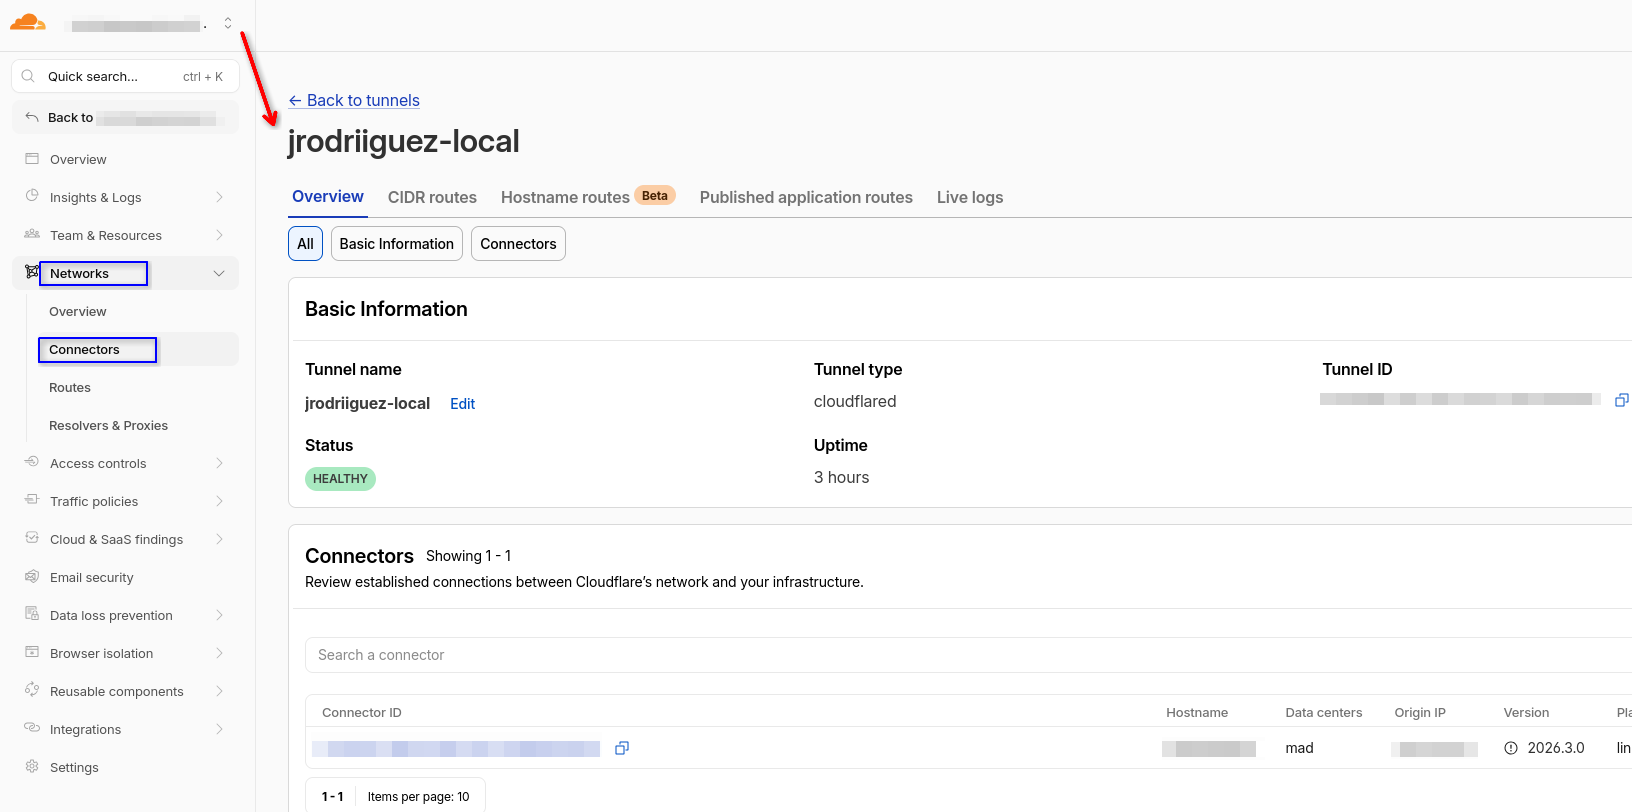
Thanks to this service, I don’t need to open ports on my router or expose my infrastructure. Now I will explain how to install it, which is quite simple:
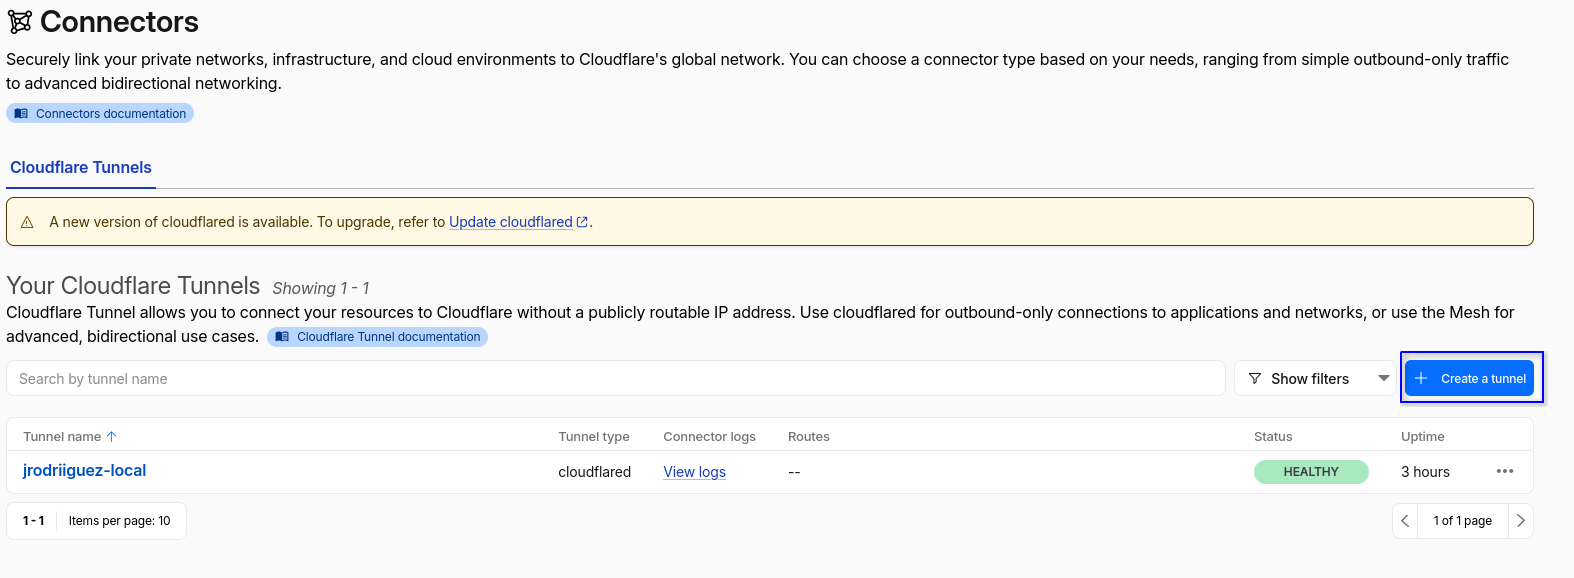
To install the tunnel, we go to the console, to the connectors section, and click on Create a tunnel.
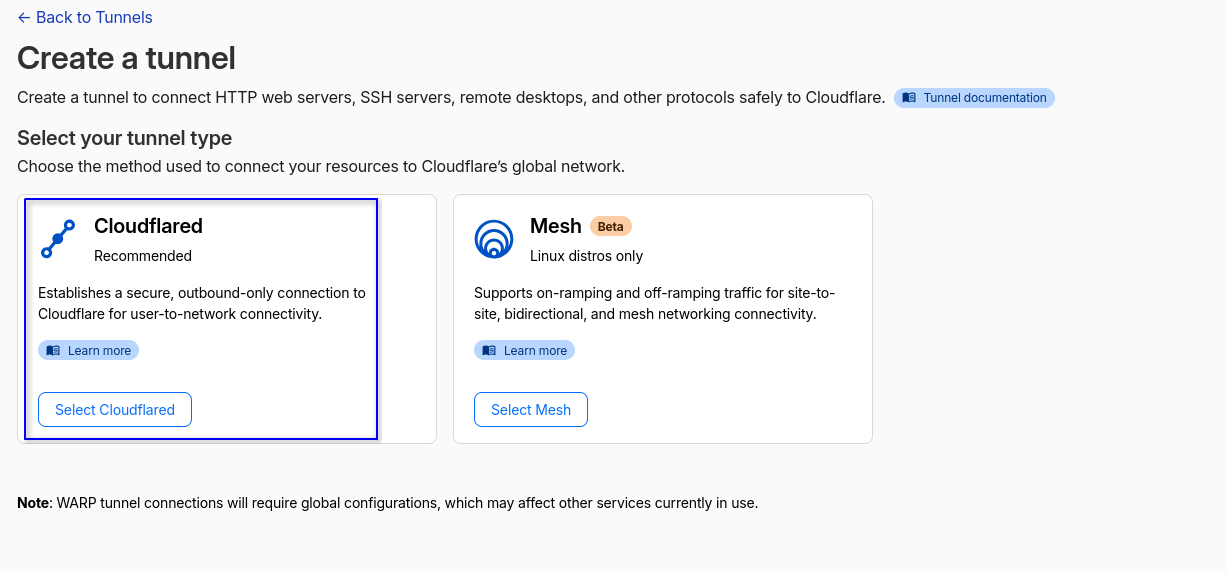
Next, it will ask us for the type of tunnel we want to use; for now, I’ve only tried cloudflared.
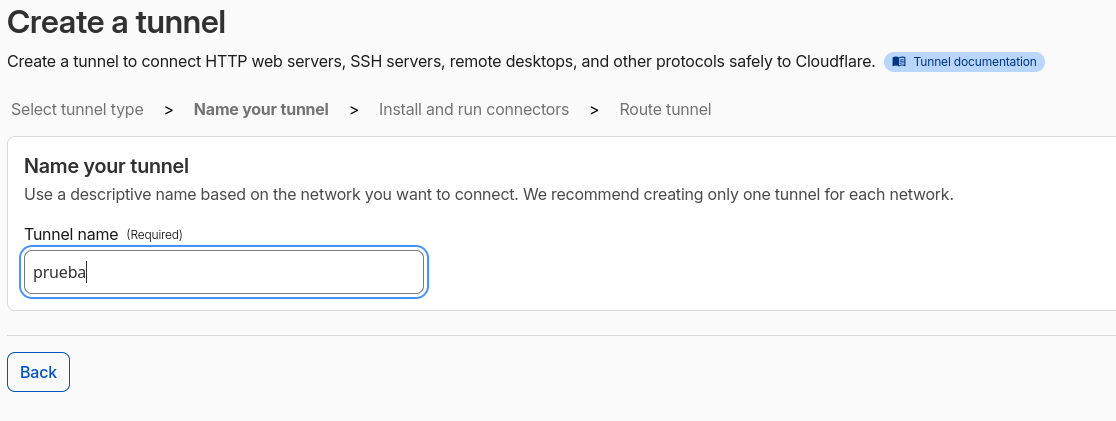
We assign it a name.
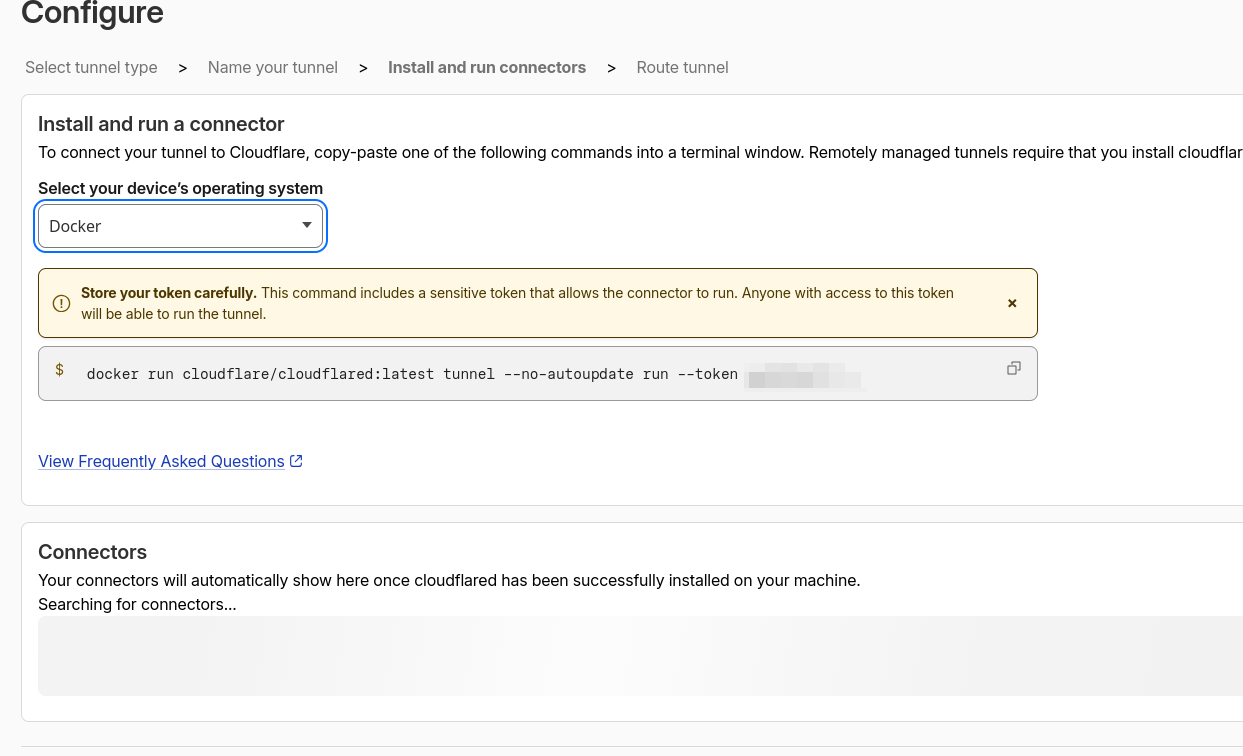
And we will get a list of deployment options; I use Docker for everything.
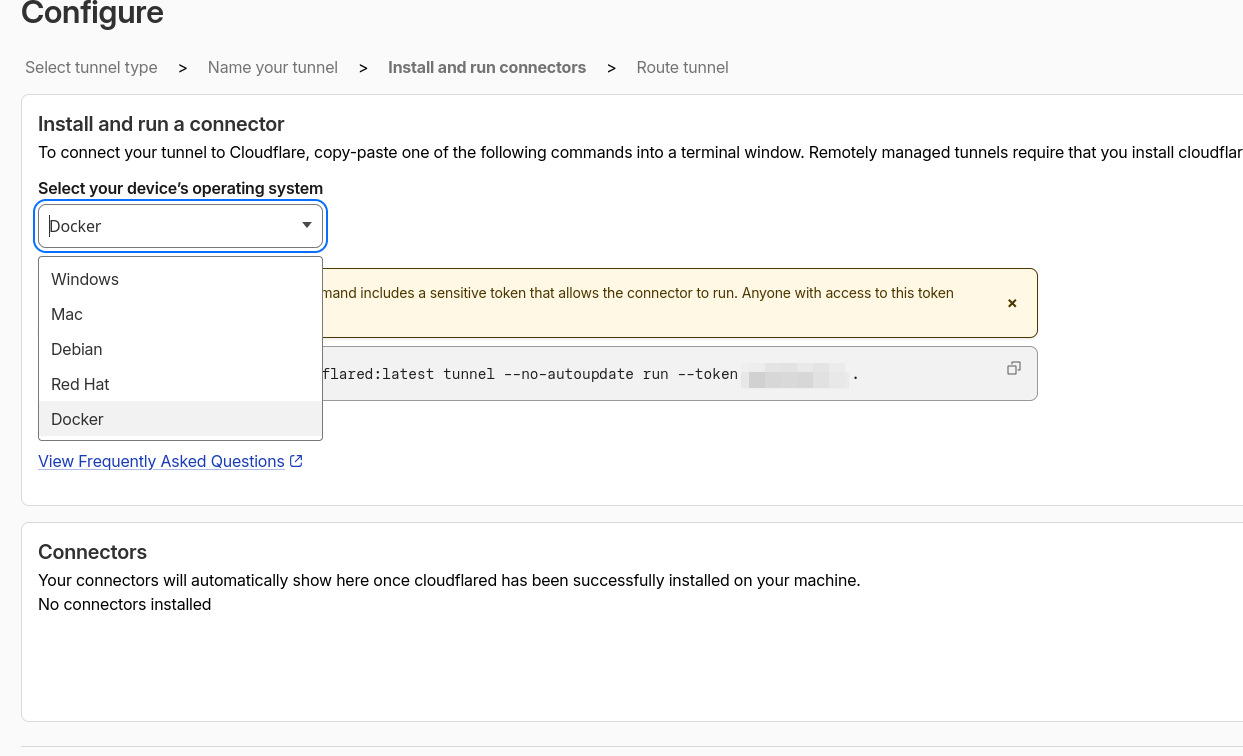
This will give us back a command with a token; this is just copy and paste in the terminal and it configures itself. After a few seconds, it will appear in the connectors console.
Conclusion
This entry may have been somewhat short. The next one, I assure you, is a bit longer, but it is better to offer small bites with quality information than a giant text that no one will read. So, up to here we have seen everything that connects my infrastructure facing the outside. Now we make a pause until the next post, in which we will start looking at the infrastructure at the local level.
Comentarios
Cargando comentarios...